
Have you ever heard about CQRS?
Maybe yes, maybe no.
Well, if you got here asking yourself how to implement CQRS, then you already know what I’m talking about.
But if you are looking for what CQRS is, then you are new.
Either way, by this and the following posts, I will progressively explain why CQRS matters, what problems it solves, why it should be the main approach for a medium/big size company who lives by its product, and how to implement it.
One data model to rule them all? No, thanks.
One of the most (if not the only) common approach that software developers unwittingly adopt in their job is to design their software on one specific data model. They think about the software in terms of that model, they think in terms of how they will store data on the database, then they write the code to handle that specific model.
But, and here’s the important part, one single data model is not suitable for data growth.
And no, it doesn’t matter whether you are planning for a microservice architecture or a monolith. If the data is planned to grow, one model is not enough.
Let me show you some examples.
Example 1: The organizational chart
VentureSaas Inc. wants to give their customers the ability to handle the organizational chart into the product, so they start planning to introduce the Organizational Chart feature.
Every part of the product will be impacted by this change, ranging from the search bar to the reports, to the dashboard widgets. The new Organizational Chart feature will be a core functionality.
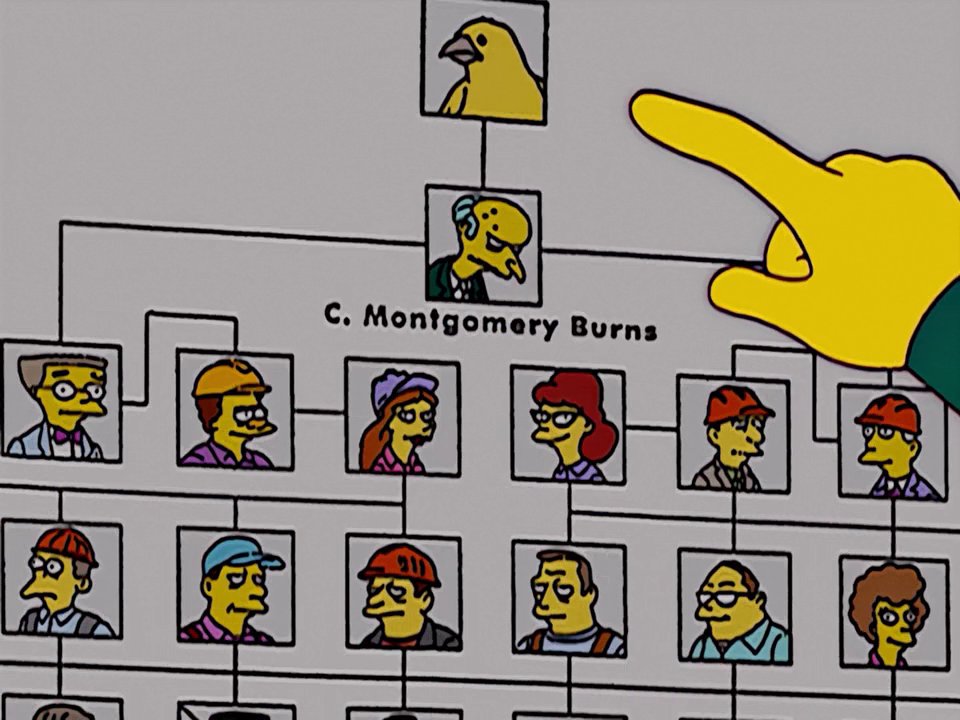
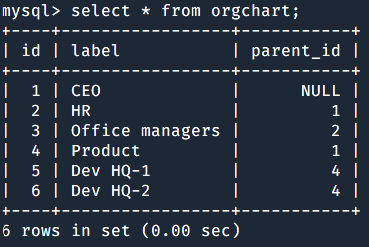
The project team started by (guess what?) modelling the database schema for the organizational chart operations. It will be easy for them – as developers – to create, rename or even drop entire organizational branches. Also, it seems to be very easy to create the relationships between employees and the branches they belong to.
This data model will suffice each and every operation.
The same model will be queried at need.
What the project team didn’t think of is the scalability.
As the first big customer started to use this new feature, everything slowed down.
It became harder and harder for them to access the users management page, as for the reports, last but not least the dashboard.
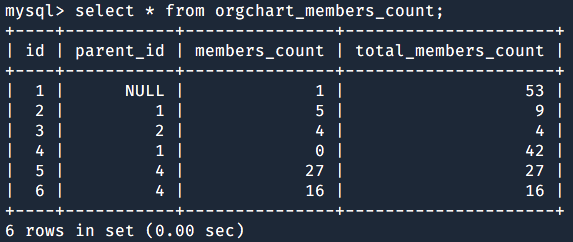
Tickets forwarded to the dev-team were clear: the new feature was performing bad because of the queries to the users catalogue, to the organizational branch and a mix of the two. Counting the number of employees in one department and all of its sub-sections was awfully slow.
The feature has been designed to query the aforementioned data model via a series of tangled, nested, difficult to read, hard to modify, slow to run queries. Guess why?
One data model to rule them all.
Example 2: The monthly expenses
Sharks&Loans Bank is planning to add a new widget to the homepage of the home banking website: a pie chart representation of the account holder’s monthly expenses. Each slice of the pie represents the monthly expense percentage relative to the running year:
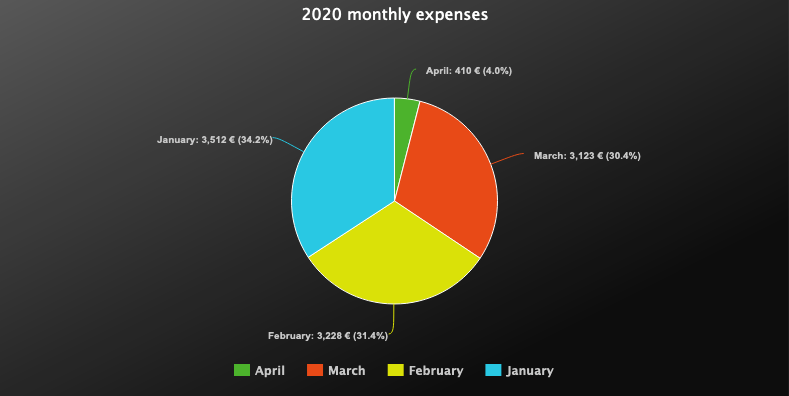
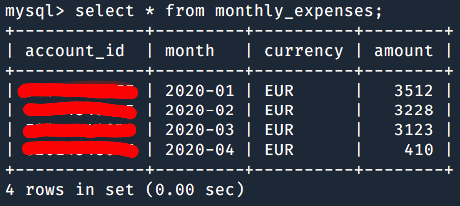
Their project team already has the “one table to rule them all” to start from: the Transactions table. Each and every bank transaction is stored in that table, along with the relative bank account id, the transaction type (deposit or withdrawal), the amount and the date:
Easy peasy. So they say.
But.
But that table is huge. And they had to write a complex query that filters the required transactions from a huge list, groups them by month, sums the amounts and calculates the percentage of each month relative to the entire year. Everything to just get the values of the pie chart from that infinite list.
A medium-complex SQL query, nothing impossible. Every developer is able to write something like that.
Now, just for fun, let’s assume that the above operation is very slow because of the too many transactions, and that’s the only data source that you can use to calculate the values you need for the pie-chart widget.
It becomes a pain in the ass.
What would you do?
I can predict your answers:
- Check for bad query practices
- Check for table indexes
- Check for misused indexes
- Try to optimize the query
- Look for some solution on stackoverflow
- Scale the database server
Everything, but a data model analysis: “That table schema is fine and the problem is somewhere else”. Right?
So what?
Why it is so hard to query a data model that, paradoxically, has been thought to be easy, at first?
“Because data has grown too much!”, a developer could reply. And indeed that developer would be true. You can’t prevent how much your data will grow, so your starting model works fine, at least for a while. But the more your customers use your product, the more data they generate. And the more customers you get, the more the data grows.
What the above developer is not thinking at all, however, is the fact that there’s really no need to scan all the historical data to just build a new representation of it.
What developers take for granted is that the required informations can be rebuilt from the actual, generic data model. And it’s not a whim, that’s for one specific reason: developers don’t want to store the same information in different formats. “Data MUST NOT be redundant” is some kind of mantra for developers, because they know that data redundancy is risky and expensive, from a coding point of view. Keeping redundant data synchronized is slow, difficult and error prone. Why should a developer mess the codebase to just write the same information in many different formats when all the possible data formats can be deduced from just one?
The “What If” game
What if the two aforementioned companies already had the data they needed, rather than having to rebuild it from scratch at need? What if it was possible for them to write redundant data, represented in different models, and get faster answers?
VentureSaas in Example 1 didn’t have to COUNT the number of employees in each branch. They could already know how many employees there are in one branch and what is the total number of employees in that branch and all of its sub-branches. Their product wouldn’t have become deadly slow.
What if Sharks&Loans Bank in Example 2 didn’t have to recalculate the monthly expenses of each account holder? What if they already had some snapshot of the monthly expenses into one, ad-hoc, data model? Their widget wouldn’t have slowed the dashboard.
But how could have been it possible for those companies to have the same data represented in different data models?
Two sides of the same coin
Both the above examples make it clear the big mistake that a software architect can make: pretending that the data model that stores the application state can be used to provide the numbers.
On the one hand a software needs to store its state, because the state tells the application where it is and where it can go. The state allows the software to determine whether a user can perform some action or not (e.g.: a debit transaction is allowed only if the account balance has enough funds).
On the other hand a software needs to store the numbers, because all the metrics, all the statistics, all the informations needed by humans (and/or by the UI) are expressed in terms of numbers.
And here’s the lying truth: a good software needs both the models.
State.
And numbers.
Two sides of the same coin.
CQRS is the word
And here’s finally what CQRS is all about: designing your software so that it can handle both the state and the numbers, without actually mixing the two.
A software designed with the CQRS pattern at its core is a software that does not fear the growth. Your customers will thank you.
What’s next?
Next episode, CQRS Episode II – Attach the cloners, will be a tech overview of the CQRS architecture.
Stay tuned!

Antonio Seprano
Apr 2020, covid-free.